Ubiquiti UniFi AP Outdoor [24/58] Quick look
Превью страниц
Страница 24 /
58
![Ubiquiti UniFi AP Outdoor [24/58] Quick look](/views2/1072883/page24/bg18.png)
21
Chapter 5: Statistics TabUniFi
™
AP-Outdoor User Guide
Ubiquiti Networks, Inc.
Chapter 5: Statistics Tab
The Statistics tab provides a visual representation of the
network traffic connected to your managed APs. Charts
representing the number of clients and network traffic are
displayed. An hour by hour chart of the usage over the last
24 hours is also displayed on this screen.
Clients
# of Clients Displays a visual pie chart representation of
the client distribution. Place the mouse cursor over the
chart for percentage details.
Quick Look
Most Active AP Displays the most active Access Point’s
details, including the name or MAC address of the Access
Point, the total amount of data sent, and the total amount
of data received.
The name or MAC address of the Access Point is a clickable
link that will open the device details page. See “Access
Point Details” on page 30 for additional information.
Most Active Client Displays the details of the most active,
currently connected client. The name or MAC address of
the client device, the total amount of data sent, and the
total amount of data received are displayed here.
The name or MAC address of the client device is a clickable
link that will open the device details page. See “User/
Guest Details” on page 40 for additional information.
All-Time Top Client Displays the details of the all-time
most active client. The name or MAC address of the
client device, the total amount of data sent, and the total
amount of data received are displayed here.
The name or MAC address of the client device is a clickable
link that will open the device details page. See “User/
Guest Details” on page 40 for additional information.
Содержание
206- Installation
- Chapter 1
- Product overview
- Access point details
- Offline clients tab
- Map tab
- Guests tab
- Chapter 9
- Chapter 8
- Chapter 7
- Chapter 6
- Chapter 5
- Chapter 4
- Chapter 3
- Using the unifi controller software
- Chapter 2
- Users tab
- Chapter 10
- Table of contents
- Statistics tab
- Access points tab
- Contact information
- Compliance information
- Chapter 12
- Chapter 11
- Appendix h
- Appendix g
- Appendix f
- Appendix e
- Warranty
- Appendix d
- User guest details
- Appendix c
- Unifi discovery utility
- Appendix b
- Specifications
- Appendix a
- Safety notices
- Portal customization
- Hotspot manager
- Declaration of conformity
- System requirements
- Package contents
- Network topology requirements
- Chapter 1 product overview
- Led indicates the status of the device see the table below for details
- Hardware overview
- Chapter 1 product overview unif
- Ap outdoor user guide
- Ubiquiti networks inc
- Note the secondary ethernet port can be used as as an uplink for other devices once they have been adopted
- Wall mount
- Mounting the unifi ap outdoor
- Hardware installation
- Chapter 2 installation
- Pole mount
- Antenna installation
- Software installation
- Pc users
- Mac users
- Configuring the unifi controller software
- Common interface options
- Clicking on an event device link
- Chapter 3 using the unifi controller software
- Access points
- Stations
- Recent events
- Interface tabs
- System configuration
- System
- Settings
- Services
- Alerts
- Mail server
- Guest policies
- Guest control
- Hotspot
- Wireless configurations
- Wireless configuration
- Admin settings
- Access control
- Wireless networks
- User groups
- Blocked devices
- Advanced
- Support info
- Server information
- Restore
- Backup
- Chapter 4 map tab
- Adding custom maps
- Adding a google map
- Placing access points on the map
- Setting the map scale
- Quick look
- Clients
- Chapter 5 statistics tab
- Recent activities
- Current usage top access points
- Chapter 6 access points tab
- Chapter 7 users tab
- Chapter 8 guests tab
- Chapter 9 offline clients tab
- Uplink wireless
- Uplink wire
- Overview
- Details
- Chapter 10 access point details
- Radio 11n b g or radio 11n a
- Downlinks
- Guests
- Configuration
- Config
- Radios
- Radio 11n b g or radio 11n a
- General settings
- Wlans 11n b g or wlans 11n a
- Network
- Wireless uplinks
- Access point heartbeat missed
- Overview
- Access point managed by other
- Access point isolated
- Advanced adoption
- Access point pending approval
- Forget this ap
- Overview
- Details
- Chapter 11 user guest details
- Statistics
- History
- Configuration
- Config
- Wireless guests
- Payments transactions
- Chapter 12 hotspot manager
- Vouchers
- Operator accounts
- Windows
- Viewing the default portal
- Overview
- Enabling portal customization
- Appendix a portal customization
- Windows
- Customizable default files
- Unifi discovery utility interface
- Pc users
- Overview
- Mac users
- Launching the unifi discovery utility
- Appendix b unifi discovery utility
- Ubiquiti networks inc
- Appendix c specifications unif
- Appendix c specifications
- Ap outdoor user guide
- Ubiquiti networks inc
- Appendix c specifications unif
- Ap outdoor user guide
- Electrical safety information
- Appendix d safety notices
- Appendix e warranty
- Warranty conditions
- Returns
- General warranty
- Disclaimer
- Rf exposure warning
- Installer compliance responsibility
- Industry canada
- Ce marking
- Appendix f compliance information
- Alert sign follows ce marking
- Rohs weee compliance statement
- Italiano
- Français
- Español
- English
- Deutsch
- Norsk norwegian
- Nederlands dutch
- Malti maltese
- Magyar hungarian
- Lietuvi lithuanian
- Latviski latvian
- Ελληνική greek
- Italiano italian
- Česky czech
- Français french
- Íslenska icelandic
- Español spanish
- Ubiquiti networks inc
- English
- Eesti estonian
- Svenska swedish
- Deutsch german
- Suomi finnish
- Dansk danish
- Slovensky slovak
- Appendix g declaration of conformity unif
- Română romanian
- Appendix g declaration of conformity
- Português portuguese
- Ap outdoor user guide
- Polski polish
- Ubiquiti networks support
- Online resources
- Appendix h contact information
Похожие устройства
-
 Ubiquiti AirRouter HPИнструкция по эксплуатации
 -
 Ubiquiti AirRouterИнструкция по эксплуатации
 -
 Ubiquiti EdgeRouter PROИнструкция по эксплуатации
 -
 Ubiquiti EdgeRouterИнструкция по эксплуатации
 -
 Ubiquiti EdgeRouter POEИнструкция по эксплуатации
 -
 Ubiquiti EdgeRouter LiteИнструкция по эксплуатации
 -
 Ubiquiti PicoStation М2Инструкция по эксплуатации
 -
Ubiquiti PicoStation 2HPИнструкция по эксплуатации
-
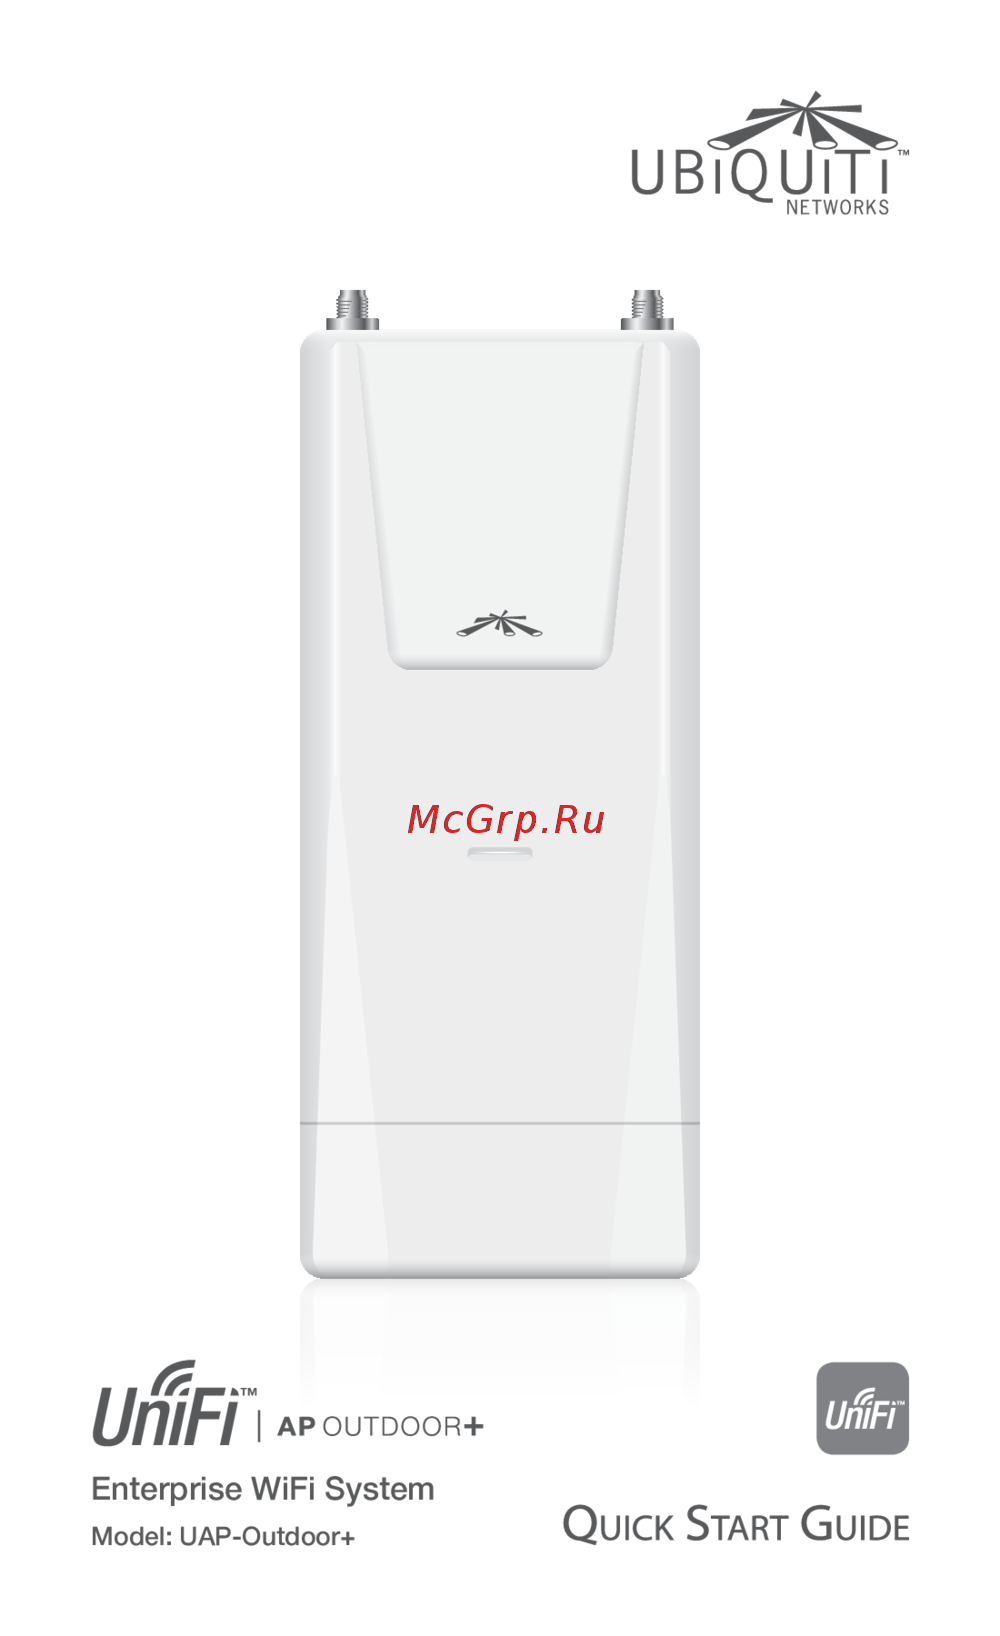 Ubiquiti UniFi AP-Outdoor+Инструкция по эксплуатации
 -
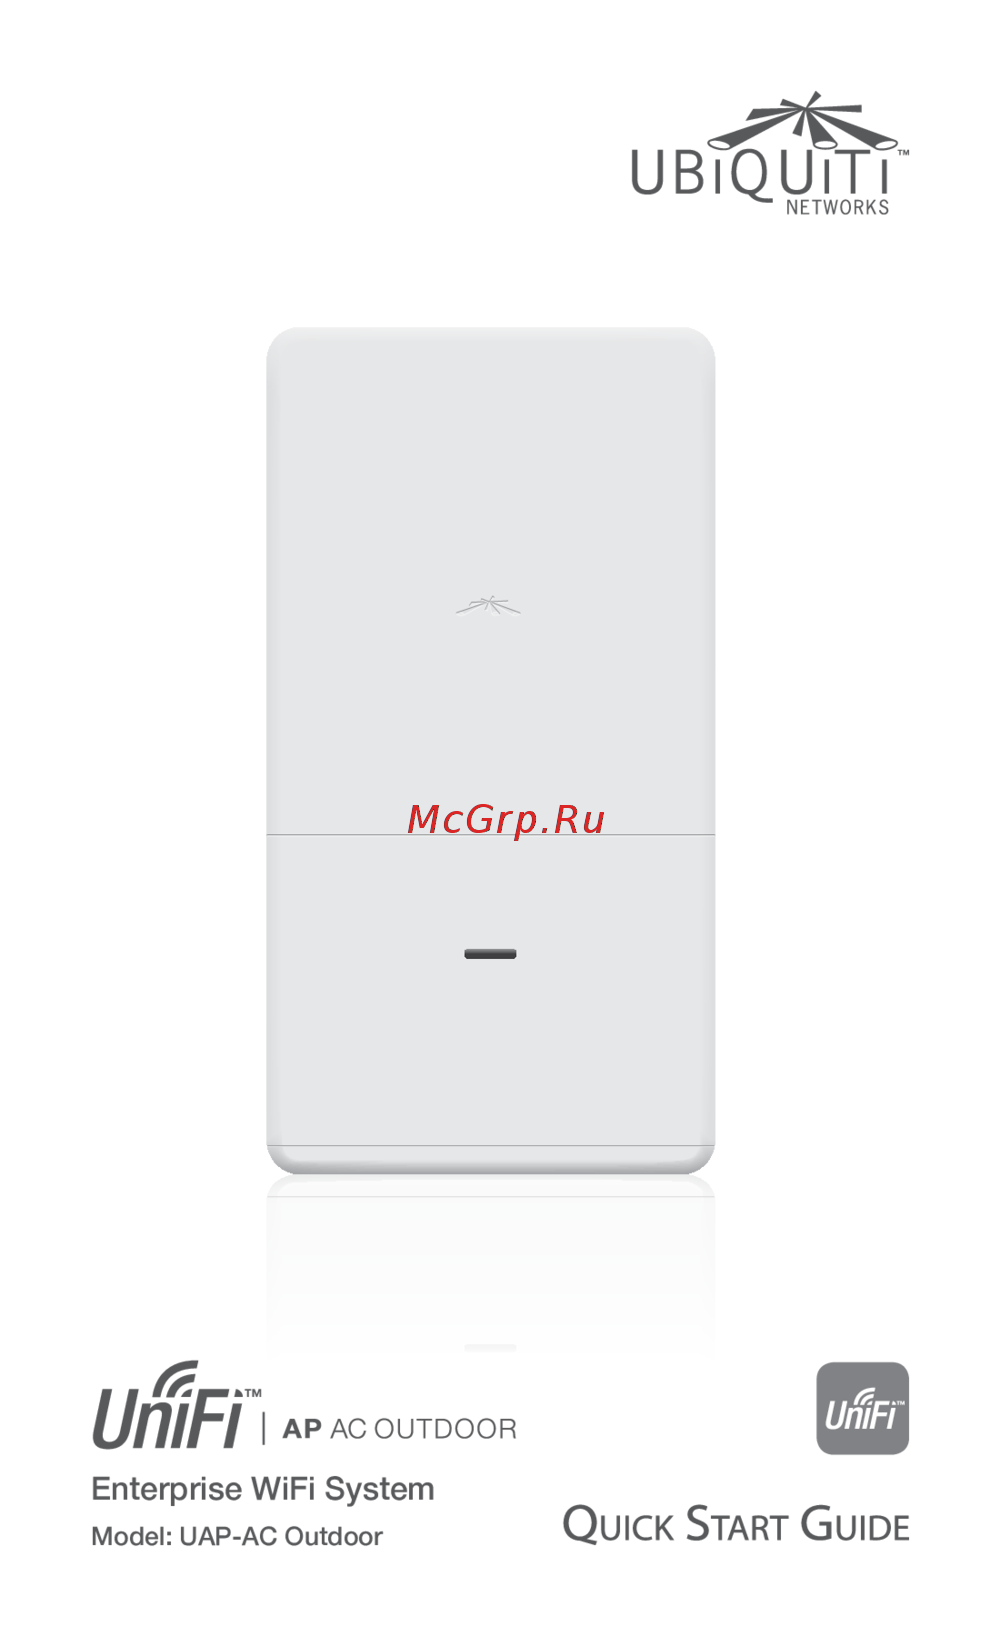 Ubiquiti UniFi AP-Outdoor ACИнструкция по эксплуатации
 -
 Ubiquiti UniFi AP ACИнструкция по эксплуатации
 -
 Ubiquiti UniFi AP Pro (UAP-Pro)Инструкция по эксплуатации